Do Developers Update Their Library Dependencies? An Empirical Study on the Impact of Security Advisories on Library Migration
(Empirical Software Engineering Journal)
Abstract
Third-party library reuse has become common practice in contemporary software development as it includes several benefits for developers. Library dependencies are constantly evolving, with newly added features and patches to fix bug in older versions. To take full advantage of third-party reuse, developers should always keep up to date with the latest versions of their library dependencies. In this paper, we investigate the extent of which developers update their library dependencies. Therefore, we conducted an empirical study on library migration that covers over 4,600 GitHub software projects and 2,700 library dependencies. Results show that although many of these systems rely heavily on dependencies, 81.5% of the studied systems still keep their outdated dependencies. In the case of updating a vulnerable dependency, the study reveals that affected developers are not likely to respond to a security advisory. Surveying these developers, we find that 69% of the interviewees claimed to be unaware of their vulnerable dependencies. Furthermore, developers are not likely to prioritize library updates, citing it as extra effort and added responsibility. This study draws the conclusions that even though third-party reuse is commonplace, the practice of updating a dependency is not as common for many developers.
Mining Tools and Libraries:
Our Dependency Extraction Tool for Maven Libraries: PomWalker
Java Library to mine and extract Library Migrations JGit
R statistics Tool (For Visualization) R
Notable R Packages used ggplot2, plyr, sqldf, gridExtra
Library Migration Plot LU Dataset
(LMP 2,949 LMP LU Metrics Including 213 Latest Versions) LMPCurves.csv
| LMPCurves | Description |
|---|---|
| Domain_Libname_Version | unique library name (domain-name-version) |
| Peak_LU | maximum population count of user systems reached by a dependency. |
| Current_LU | latest population count of user systems that and actively using the dependency in their systems |
| Pre_Peak | time taken for a dependency to reach a peak LU (days) |
| Post_Peak | time since the peak LU was reached (days) |
| Library_Residue | Current_LU/ Peak_LU |
Library Dependency Migration Datasets
Raw List of Java Projects (10,851 projects: Before pre-processing quality check): Projects.csv
| Projects Attributes | Description |
|---|---|
| url | GitHub url link of the project respository |
| authors | # of authors that are part of the project |
| name | Name of the project repository in GitHub |
Library Migration Dependencies (852,322 Dependency Migrations) LibraryMigrations.csv *(Note contains implicit ${versions})
| GitHubData Attributes | Description |
|---|---|
| repo | Name of the project repository in GitHub |
| repoSys | unique of system in repo (repo_system) |
| dependsDate | Date when the dependency was first adopted |
| initial | Date when the first version of library was adopted |
| latest | Date when the latest version was last seen |
| type | Used to monitor LU (a=migration)(b=idle) |
| libSum | library name (name version) |
| artifactLib | unique library name (domain-name-version) |
Example LMP
Download and Load R function to generate an LMP: LMPCurve.r
Load required library packages
library(ggplot2)
library(gridExtra)
library(sqldf)
library(plyr)
require(stringr)
#Load the libraryMigrations.csv
libraryMigrations <- read.csv("~libraryMigrations.csv")
Generate LMP Plot
Our function parameters are as follows:
function(lib1, lib2, lib3, dataSet, projectThreshold, 1Annotate, 2Annotate)
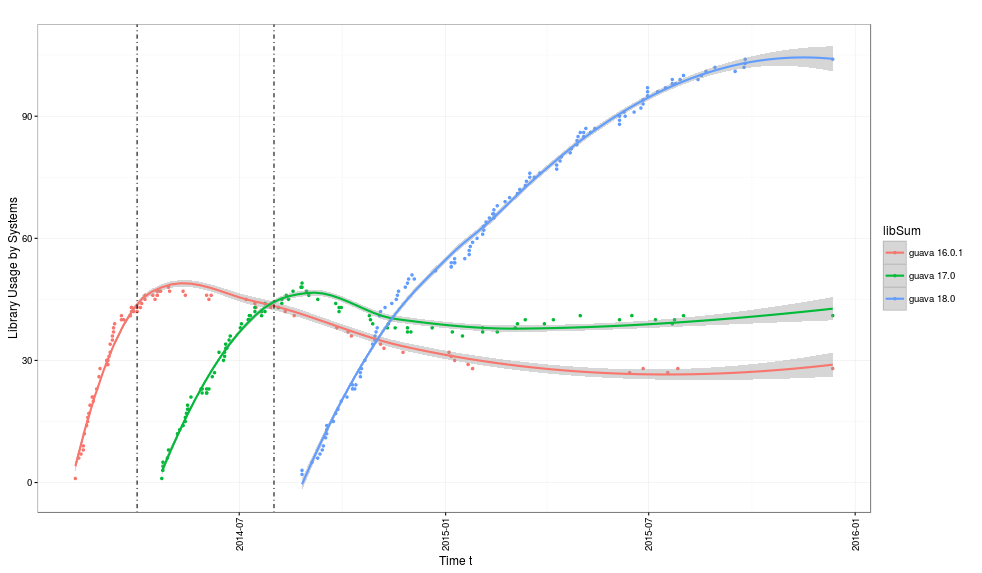
For example, we test for guava versions 16.0.1, 17.0, 18.0 and we only plot projects that are active till 2015-01-01 and we annotate dates “2014-04-01” (release month of 17.0) and “2014-08-01” (release month of 18.0)
lib.getThreeCurve("com.google.guava-guava-16.0.1",
  "com.google.guava-guava-17.0",
  "com.google.guava-guava-18.0",
  "libraryMigrations",
  as.Date("2015-01-01", "%Y-%m-%d"),
  as.Date("2014-04-01", "%Y-%m-%d"),
  as.Date("2014-08-01", "%Y-%m-%d"))
The Raw LMP (without annotations) is shown below: